


This is a DRAFT of the second part of Chapter 4 - On CPU Physics and CPU Cycles, of the Vol.1 of an upcoming book "Efficient C++ Programming for Modern 64-bit CPUs" by Sherry Ignatchenko and Dmytro Ivanchykhin. Feel free to comment on it - especially if you see some factual inconsistencies, we'll be happy to fix them.
For the first part of Chapter 4, see https://6it.dev/blog/on-cpu-physics-and-cpu-cycles-80730.
Cold Hard Numbers
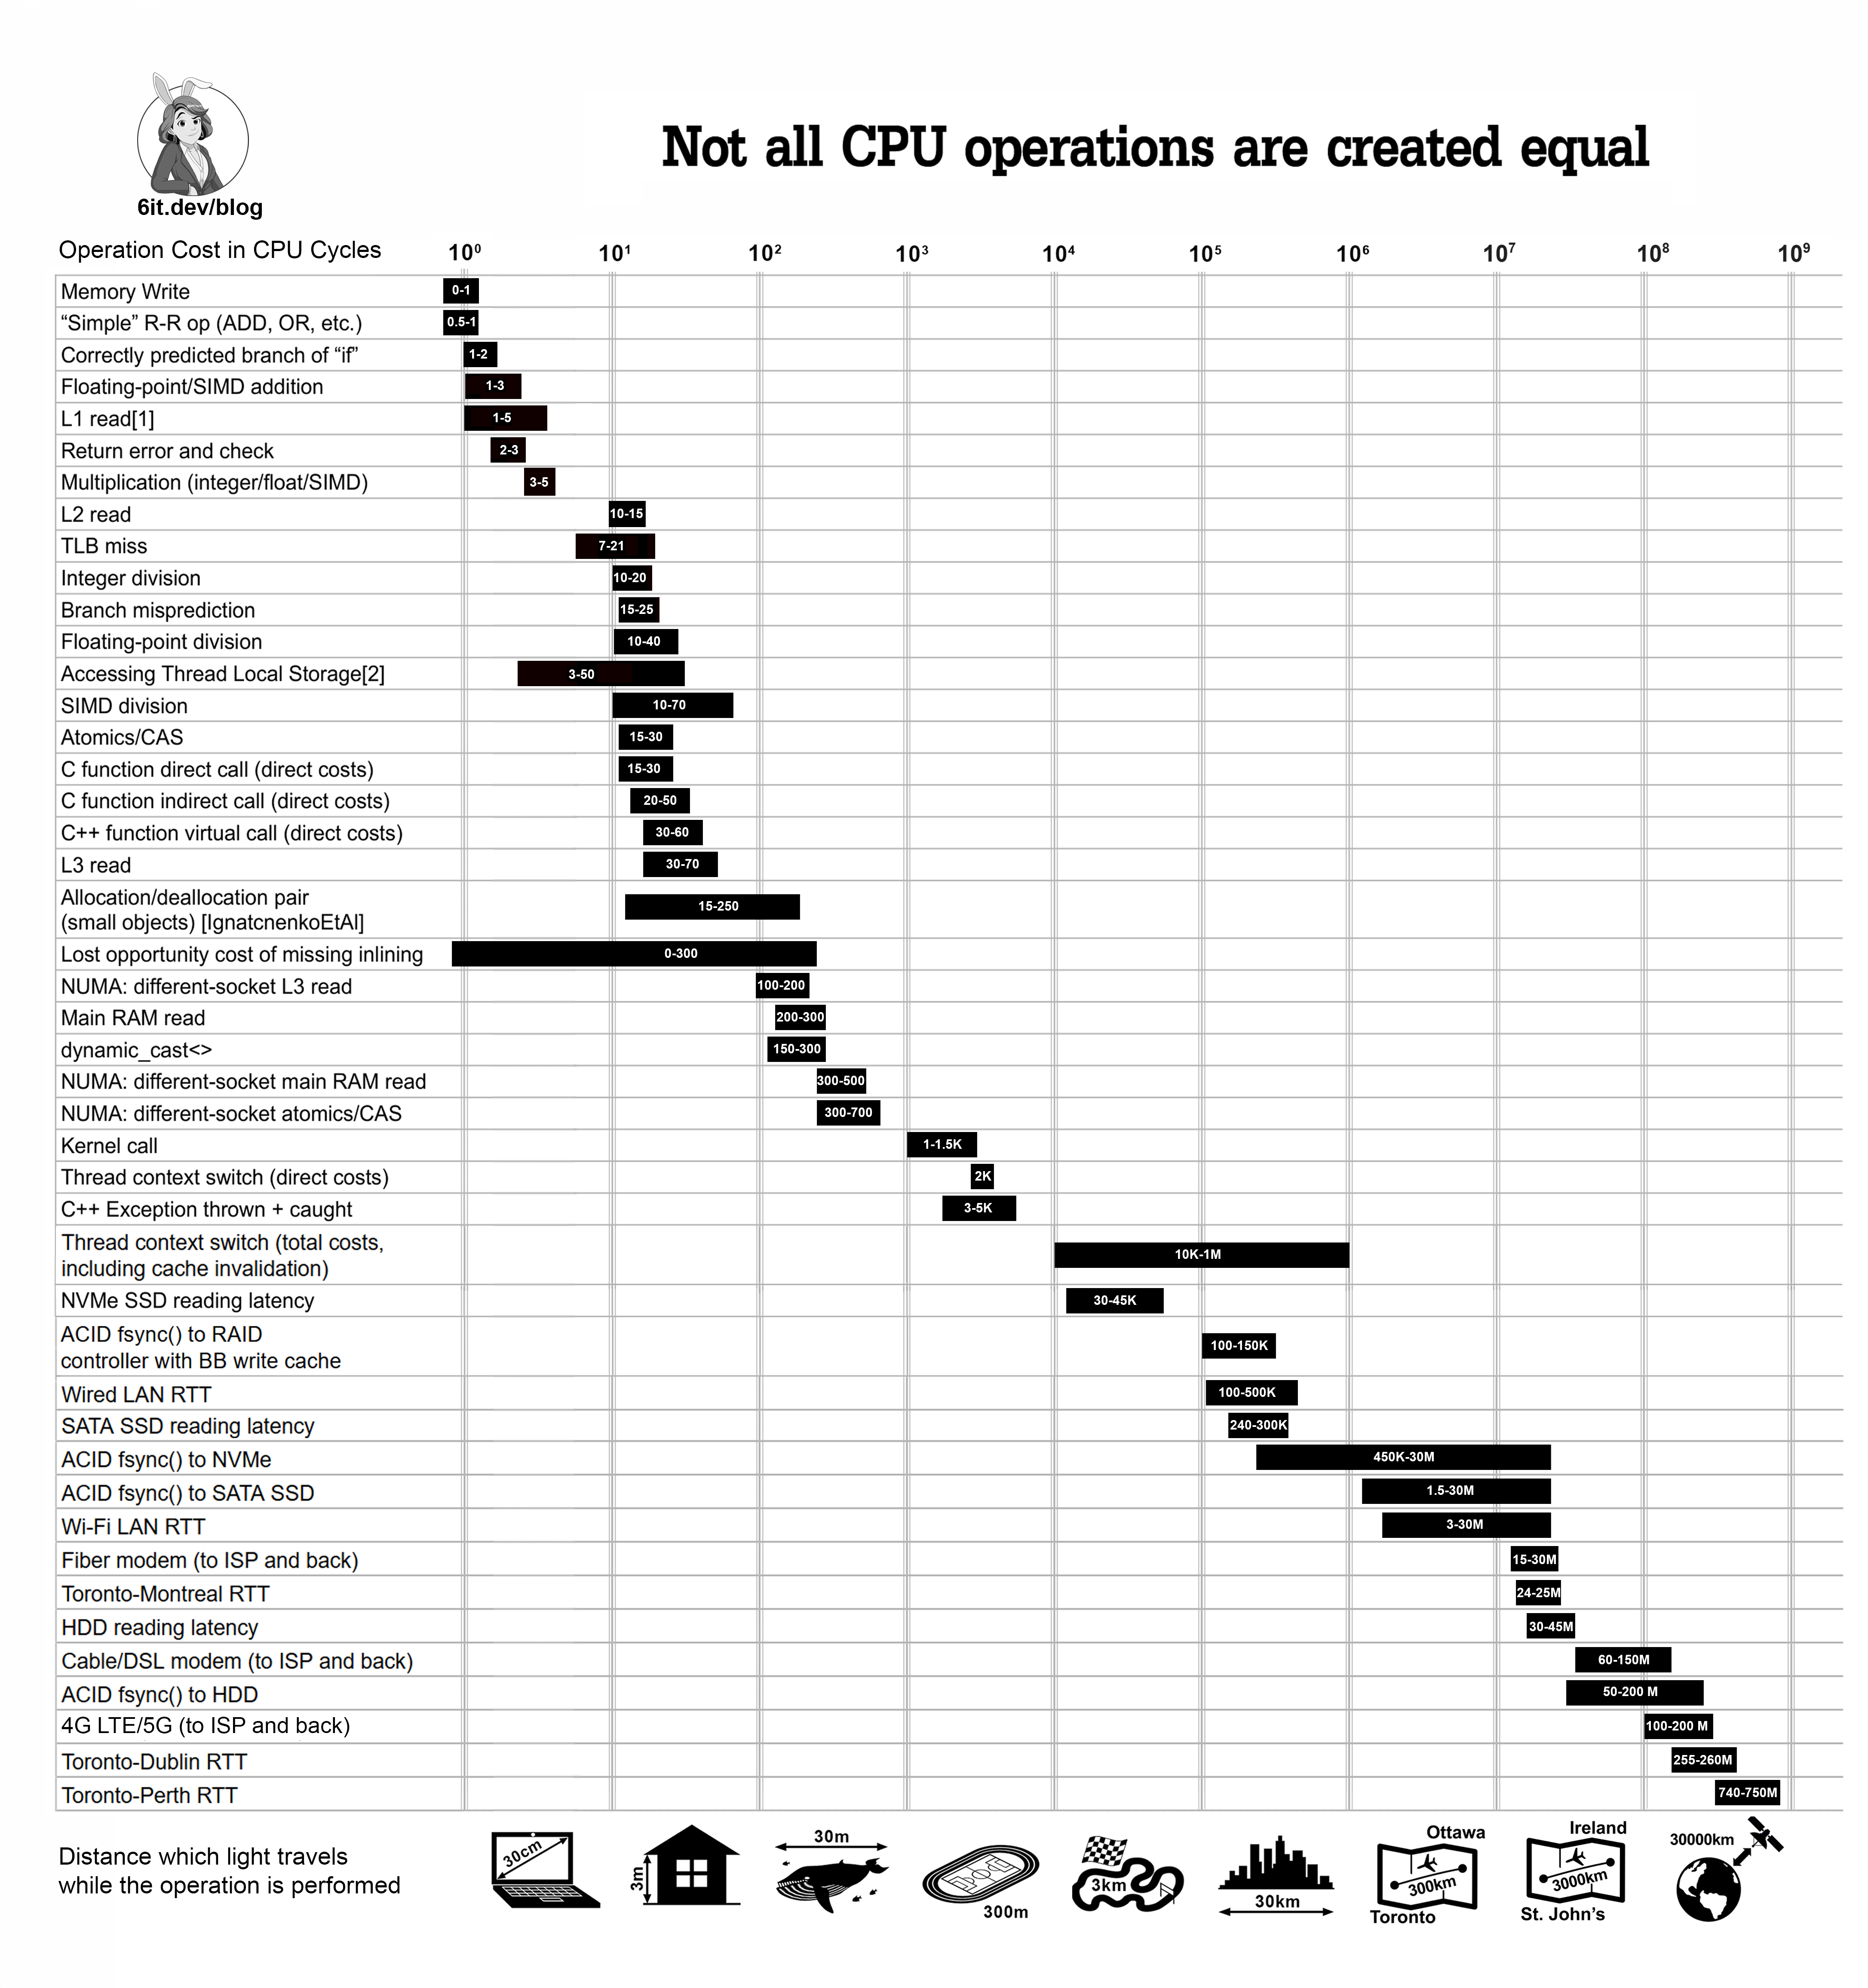
Now, armed with all the information above (and adding bits from [Ignatchenko16a], [Fog], and other sources listed below), we can make an all-important diagram to replace micro-benchmarks for many practical purposes, and indicate costs of most popular operations in the dev’s vocabulary.
DISCLAIMER: all the numbers below are accurate only within an order of magnitude!
Note that some of the items here were not discussed above, and may need some additional explanation:
Multiplication / Division
Out of all the R-R operations out there, multiplication and especially division are rather special performance-wise. All the ops besides multiplication and division are Darn Cheap™ - they usually tend to have latencies along the lines of 1, or if this particular op was deemed not-so-important by CPU designers – 2 CPU cycles; moreover, for non-multiply/divide ops usually there is no difference whatsoever depending on the bitness of the operands: that is, any op besides multiplication and division tends to take the same time for 8-bit, 16-bit, 32-bit, and 64-bit operands.
In contrast, multiplication tends to take 3-5 CPU cycles, and moreover, it may take a different number of CPU cycles for 32-bit and 64-bit operands. For divisions, it is even worse: even modern CPUs tend to take as much as 15 CPU cycles for 64-bit divisions (and we should be thankful even for these numbers, as [Fog] lists them at 100+ CPU cycles, ouch!). For more recent CPUs, [uops] and [Cortex-A78] give us the following operation latencies (in CPU cycles):
Skylake-X (2017) | Zen 2 (2019) | Cortex-A78 (2020) | Alder Lake-P (2021) | Alder Lake-E (2021) | Zen 4 (2022) | |
|---|---|---|---|---|---|---|
Arch | x64/Intel | x64/AMD | AArch64 | x64/Intel | x64/Intel | x64/AMD |
IMUL R32, R32 | 3 | 3 | 2 (MUL, W-form) | 3 | 3 | 3 |
IMUL R64, R64 | 3 | 3 | 2 (MUL, X-form) | 3 | 5 | 3 |
IDIV R32 | 23-28 | 8-25 | 5-12 (DIV, W-form) | 10-15 | 11-28 | 9-14 |
IDIV R64 | 37-96 | 8-41 | 5-20 (DIV, X-form) | 14-18 | 11-24 | 9-19 |
To summarize it (for really modern 64-bit CPUs, i.e. roughly starting from 2019-2021):
- in spite of all the improvements made, division is still Darn Expensive™ (though not as expensive as it used to be)
- while since about 2020, the difference between 32-bit and 64-bit division is not that drastic, it still exists
- as for multiplication – it is almost the same for 32-bit and 64-bit versions (except for certain E-cores).
RTTI
RTTI can be quite expensive, with dynamic_cast<> being up to 5x more expensive than a simple virtual function call (sic!) [TR][Didriksen].
TODO: benchmark performance of virtual call vs typeid vs dynamic_cast (sources give very conflicting and potentially-outdated data, need to experiment ourselves)
Note though, that contrary to certain claims (see e.g. [Fog04, section 7.23]), RTTI doesn’t add anything to the instances of the class objects (for polymorphic classes, RTTI uses the same vfptr which is already there, and for non-polymorphic ones there is no RTTI at all). Still, RTTI does add to the code size.
C++ Exceptions vs Return-value-and-check
C++ has long took a position that its exceptions are designed to be more efficient than C-style return-error-and-check-it. And in fact, for code where errors are extremely rare, it seems to stand. For example, micro-benchmarks from [Nayar] indicate that return with error code takes 2 CPU cycles more than return without error code. OTOH, whenever C++ exception does happen, it costs a Damn Lot™ - per [Ongaro], exceptions cost around 5’000 cycles (sic!), and per [Nayar] – around 2’700 cycles. It means that if we have 1 exception per 100 function calls – we’d be better using returns, but anywhere from 10’000 successful calls per exception and up – C++ exceptions win.
Yes, we know that this goes against [Fog04]’s claim of “All functions have to save some information for the exception handler, even if no exception ever happens.” – but this statement is hopelessly outdated by 2026; this observation from [Fog04] most likely refers to storing unwinding information within specially adjusted stack frames (see “The Code Approach” in [TR, section 5.4]), but for a long while all major compilers implement “The Table Approach” from the same section in [TR], which is currently commonly referred to as “zero-cost exceptions”.
Atomics, CAS, and LL/SC
FSB
Front-Side Bus
Historically, atomic operations (in particular, CAS=compare-and-swap) were introduced in FSB-based architectures using system-wide “LOCK” over the FSB. These days, however, FSB being gone since early 2000s (thanks AMD64 and Opteron which pioneered switch to NUMA in x86/x64 world), it is all about some cache coherence protocol, usually some variation of MESI. As for cpu cycles involved, [AlBahra] provides an estimate of about 15 CPU cycles for a CAS operation; for multi-socket NUMA scenarios, however, it can easily get up to 300-600 cycles.
In addition, atomics tend to have some unpleasant side-effects going beyond direct increase in latency; in times of FSB, atomics used to cause a global bus lock, which meant an observable performance hit on multi-core / multi-socket systems; these days, with FSB replaced with NUMA and MESI-like protocols, situation got better, but is still causing quite significant effects such as “[preventing] instruction level parallelism, significantly limiting the bandwidth (up to 30x in comparison with simple writes), even if there are no dependencies between the successive operations” [SchweizerEtAl]; see also [Josuttis] for a discussion on related effects such as write stalls.
Let’s also note that atomics support under RISC-V is not CAS-oriented, it is LL/SC oriented, with its own set of advantages and quirks; recent ARMs support both LL/SC and CAS, and x64 is traditionally CAS-oriented.
Function Calls and Inlining
Historically, [BulkaMayhew, p.115] estimated the CPU cost of a function call at around 25–250 cycles, depending on the number of parameters. However, the book from 2000 feels quite dated now, and we haven’t found a reasonably authoritative modern reference 😕. That being said, based on our own experience, a function with a modest number of parameters tends to cost more like 15–30 cycles. – in direct costs, that is. This observation also seems consistent for non-Intel CPUs, as noted by [Ruskin].
As for indirect calls (calls via function pointer), [Ignatchenko16a] gives an estimate of 20-50 cycles, and for C++ virtual function costs – 30-60 cycles, which seems to be consistent with [Ruskin] too.
Last but not least, we need to consider what happens when compiler inlines a function. In such a case, not only we no longer incur those direct costs of function call (whether the call itself is direct, or indirect, or virtual) – but also compiler, after inlining, will optimize caller-function plus inlined callee-function as a whole. Just as one example – if we have code like
int square(int x) {
  return x*x;
}
int cube(int x) {
  return x*x*x;
}
int g(int x) {
  return square(x) + cube(x);
}
, then when g() is compiled with square() and cube() inlined, x64 Clang reduces it into simple
mov  eax, edi
imul eax, eax
imul edi, eax
add  eax, edi
- as we can see, there are only 2 multiplications and one addition.
However, when prohibiting inlining, effective generated code (even besides extra mov s, push es/pop s, and manipulations with stack pointer which can be attributed to direct function call costs), results in 3 imul s, and 1 add , i.e. at least one imul was not optimized out due to lack of inlining. In other words – within non-inlined code, at least one imul represents lost opportunity cost due to lack of inlining. Which makes perfect sense BTW – if we think about it a bit, we’ll realize that without inlining, such an optimizing out of an extra imul (by realizing that calculation of square() can be used as a part of calculation within cube() , so compiler effectively rewrites x*x+x*x*x into (x*x)*(1+x) , saving one multiplication) is not possible at all (sic!). And in practice, such lost opportunity costs can easily go into many dozens of CPU cycles; as another example – if we have two calls of a function f() with the same params, where f() can be arbitrarily expensive, compiler cannot optimize the second call to f() out until it is inlined (hey, what if f() has side effects?), but as soon as it can see the body of f() – it has enough information to realize “hey, it has no side effects, so we can optimize second call out!”. See also examples of inlining saving the day in [TODL: hint # about non-mutable semantics], and discussion on [Carruth19] in Chapter 12.
Let’s note (as it was highlighted by [Godbolt19]), that some (though not all) optimizations-enabled-by-inlining are not actually about inlining per se, they’re about visibility of the function body to the compiler (see e.g. our example above re second call to function f()); OTOH, assuring visibility without inlining, while potentially possible (say, by declaring function in header with force-uninlining) is usually not too practical, so overall adage of “inlining helps compiler to optimize” still stands.
Thread Local Storage
Those thread_local variables (compared to direct access to data) are not free; moreover, implementations under different compilers vary significantly even for one single platform; while last time we checked, for x64 under GCC and Clang pointer to TLS was actually stored in FS register, and TLS access comes at a cost of one extra indirection, under MSVC it may incur up to 3 extra indirections – and while these places accessed are usually well-cached, they’re still indirections, which raises the costs of accessing a thread_local variable 😔.
Thread Context Switches
As for thread context switches, the general consensus is that they’re “damn expensive” (after all, it is most likely a reason why nginx outperforms Apache). But how expensive is “damn expensive,” really? From our own experience, context switches tend to cost somewhere between 10’000 and 100’000 CPU cycles. This goes well with some related real-world observations; for example, for Windows/x64 CRITICAL_SECTION, the default spin count is 4000 iterations. It means that it usually makes sense to burn through 4000 spins — consuming at least 15–20K CPU cycles, and sometimes more like 40–50K — just waiting for a lock with the only aim being to avoid that Damn Thread Context Switch™ (and with a chance that all 4000 spins are wasted and we go into the context switch anyway, incurring both costs of spinning, and costs of thread context switch!). Of course, that strongly implies the context switch spinlock tries to avoid, is significantly more expensive than those 15-50K CPU cycles wasted spinning. That being said, many sources report much lower number. The discrepancy arises from the fact that it depends heavily on what exactly you're measuring. As [LiEtAl] explains, there are two different kinds of costs associated with context switching.
First, there’s the direct cost of switching threads. This is the relatively lightweight part — typically around 2,000 CPU cycles.
But the indirect cost — primarily due to cache invalidation — tends to be much more significant. According to [LiEtAl], this can reach up to 3 million CPU cycles. Theoretically, with a completely random memory access pattern, a modern CPU with a 12MB L3 cache (and assuming around 150 cycles per cache miss - that's comparing L3 access to main memory access) could experience penalties up to 30 million cycles per context switch. In practice, though, it’s usually less severe, but even 1 million cycles clearly qualifies as “damn expensive”.
References
[Ignatchenko16a] S. Ignatchenko, Operation Costs in CPU Clock Cycles 1 ↩ 2 ↩
[Fog] Agner Fog, Instruction tables. Lists of instruction latencies, throughputs and micro-operation breakdowns for Intel, AMD, and VIA CPUs 1 ↩ 2 ↩
[uops] uops.info table ↩
[Cortex-A78] Arm® Cortex®-A78 Software Optimization Guide ↩
[TR] Technical Report on C++ Performance 1 ↩ section 5.4 ↩ 3 ↩
[Didriksen] Tino Didriksen, C++ dynamic_cast Performance ↩
[Fog04] Agner Fog, Optimizing software in C++ section 7.23 ↩ 2 ↩ 3 ↩
[Nayar] Amit Nayar, Investigating the performance overhead of C++ exceptions 1 ↩ 2 ↩
[Ongaro] Diego Ongaro, The Cost of Exceptions in C++ ↩
[AlBahra] Samy Al Bahra, Nonblocking Algorithms and Scalable Multicore Programming ↩
[SchweizerEtAl] Hermann Schweizer, Maciej Besta, and Torsten Hoefler, Evaluating the Cost of Atomic Operations on Modern Architectures ↩
[Josuttis] Nicolai Josuttis, The Price of Shared Pointers or Why Passing them by-reference can be Useful ↩
[BulkaMayhew] Dov Bulka, David Mayhew, Efficient C++: Performance Programming Techniques p.115 ↩
[Ruskin] Elan Ruskin, HOW SLOW ARE VIRTUAL FUNCTIONS REALLY? 1 ↩ 2 ↩
[Carruth19] Chandler Carruth, There Are No Zero-cost Abstractions ↩
[Godbolt19] Matt Godbolt, Optimizations in C++ Compilers ↩
[LiEtAl] Chuanpeng Li, Chen Ding, Kai Shen, Quantifying The Cost of Context Switch 1 ↩ 2 ↩


Comments