


This is a DRAFT of the first part of Chapter 4 - On CPU Physics and CPU Cycles, of the Vol.1 of an upcoming book "Efficient C++ Programming for Modern 64-bit CPUs" by Sherry Ignatchenko and Dmytro Ivanchykhin. Feel free to comment on it - especially if you see some factual inconsistencies, we'll be happy to fix them.

Another benefit of striving for efficiency is that
the process forces you to understand the problem in more depth
— Alex Stepanov, author of the original STL
Now, let’s get down to some specifics. Let’s see Fig. 1 for a diagram of a “representative” motherboard, which has a “representative” CPU chip, which in turn has a “representative” CPU core. Here, we’re intentionally NOT referring to any specific motherboard or CPU design, just saying they’re “representative” in the sense that “it's more or less common to see similar things in 2026 CPUs”.
Before delving into all the exciting details of the picture, let’s postulate one thing:
the farther physically our electrical signal has to go, the slower our access is.
characteristic times of electronic signals are restricted by so-called parasitic capacitances, and parasitic capacitances in general are proportional to the length of the connection
This is a pretty much universal law in the realm of well-designed electronics; however, for smaller distances, it is not directly related to a fundamental restriction imposed by the speed of light. Indeed, for light to go across mere 0.5mm and back would take mere 3e-12 seconds; and in practice, even an R-R operation takes like 3e-10 seconds, two orders of magnitude more.
Rather, at least for the CPU core, this relation between distance and speed is a manifestation of an observation that characteristic times of electronic signals are restricted by so-called parasitic capacitances, and parasitic capacitances in general are proportional to the length of the connection.
Core
Now, to the details on Fig.1. Usually, when we’re writing something like a += b;, it is a register-register (R-R) operation, so the data has to go from Registers to ALU (or SIMD) and back. However, all our 64-bit CPUs are actually pipelined, so that by the time the ALU needs this information, it is often already at the ALU entrance, so in most cases we can avoid the latency penalty of going from registers to ALU and back. Simple operations such as additions/subtractions and bitwise ops, take 1 CPU cycle; multiplication takes around 3-6 cycles, and division – up to 20 cycles (note that compared to [Fog], where 64-bit division was taking up to 100+ CPU cycles, during few last years division times have improved significantly, see a table in Cold Hard Numbers section below).
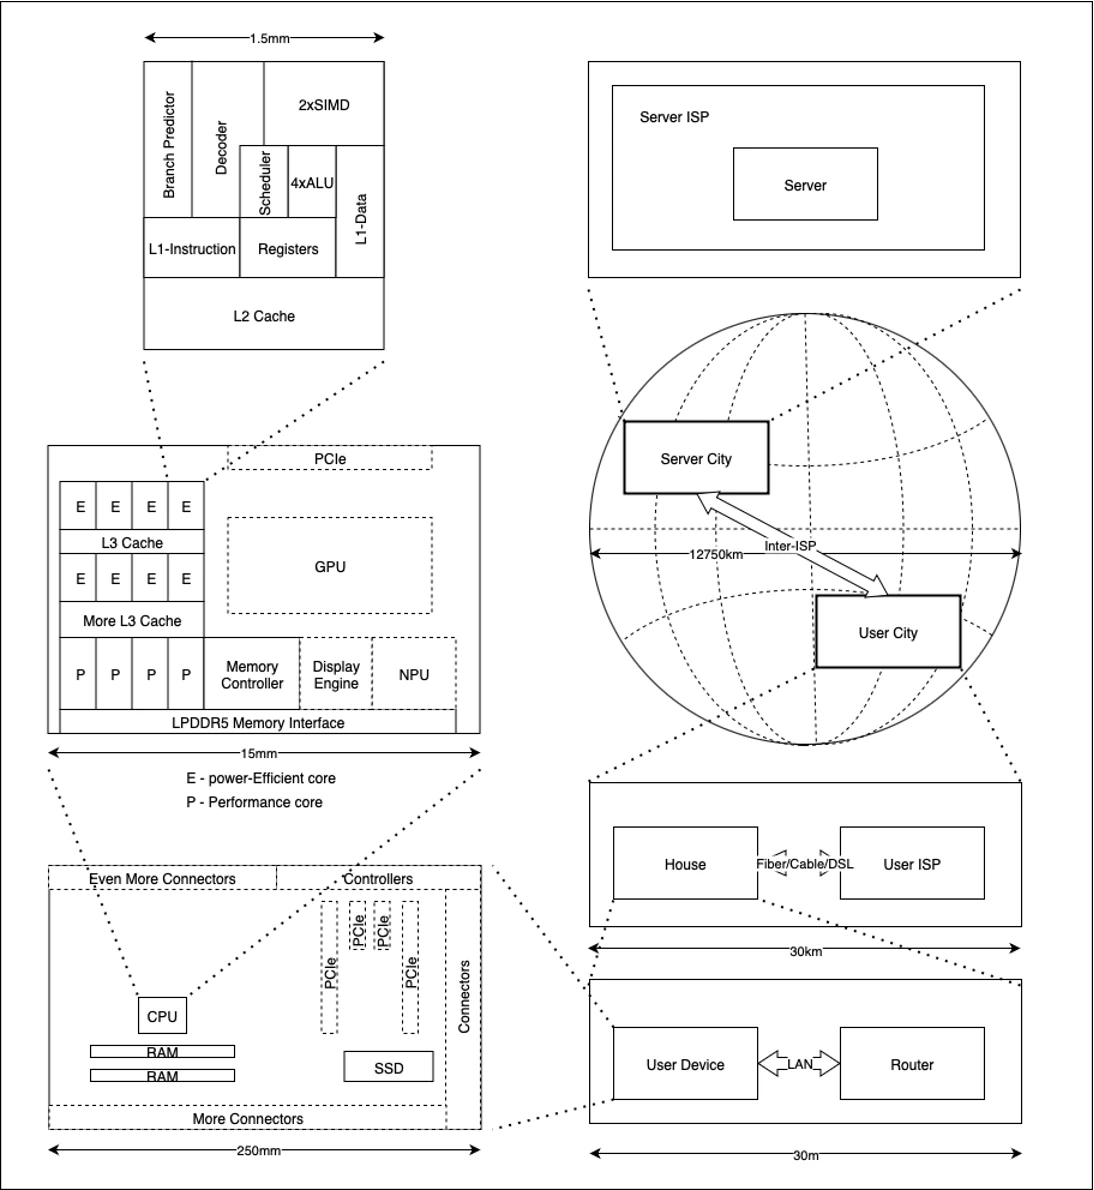
Fig. 1
L1D/L1I
L1 cache is commonly split into L1 Data cache (L1D) and L1 Instruction cache (L1I).
One interesting thing about ALU which can be seen on the diagram is that there is usually more than one ALU (and more than one SIMD unit too); this indicates that our CPU is a superscalar one, and can process more than one ALU-level operation at once 1 This, in turn, means that it is perfectly possible to have more than one operation completed at the same CPU cycle; this can lead to some counter-intuitive observations that in micro-benchmarking some operations can take some non-integer number of cycles (such as 0.75); it doesn’t mean that some operation literally took less than one cycle; it rather means that statistically CPU has managed to arrange things so that on average it performs 4 operations within 3 cycles. More generally, modern superscalar CPUs can have so-called Retired Instructions Per Cycle (RIPC) all the way up to 10-12, though in RL achieving even 4 is quite a challenge and is usually limited to ALU-bound algorithms (opposed to RAM-bound ones).
If we need to access some information outside of the CPU Registers – CPU has to go to the memory, but as the memory is cached, it goes to the closest one L1 (actually – L1D) cache first; reading from L1D cache usually takes like 3 CPU cycles these days. Note though that writing is “almost instant"2 from the point of view of CPU; indeed, all CPU has to do is to issue an instruction to L1D “just write it”, and it doesn’t really need to wait for anything here.
Going to L2 (if L1D is missed) is significantly more expensive than to L1, usually at 10-15 cycles.
Branch Mispredictions and [[likely]]/[[unlikely]]
Let’s keep in mind that while there is a lot of stuff in the “instruction” part of the core, we at our app-level don’t need to care too much about it; all of it is near-perfectly optimized, and unless branching is involved, modern compilers will ensure that our code works without delaying things – i.e. by the time our data comes in, all the instructions are ready to execute, and vast majority of the delays and stalls are data-related and not instructions-related.
One notable exception, however, is related to branching. Whenever CPU reaches a point of some branching instruction (such as JZ/BEQ or JNC/BLO instructions in x64/ARM) – logically, it cannot really go ahead until it calculates the condition (which means the need to get the data, which can be rather long). To avoid this stalling, modern CPUs (AFAWU, all of them) speculate about the instruction, and make a guess what the result will be; after making such a guess – CPU will assume that the guess stands and will proceed with this assumption in mind. Then, if the result will finally match this guess, everything is fine, and if not, the CPU will discard everything calculated based on the guess, and will restart processing right after the branching instruction.
Of course, such discarding is relatively expensive; this is known as the cost of branch misprediction (which takes on the order of 15-25 cycles [Fog04, section 7.12]). The interesting part we as devs can deal with, is about “how to affect choosing which branch is more likely”, which in turn affects number of branch mispredictions (if 99% of the time the ‘right’ branch is chosen, we’re avoiding branch mispredictions penalties almost entirely; note, however, is that whenever branch has a 50-50 chance, we cannot possibly do much about it – whatever we or dynamic branch predictor do, it will mispredict 50% of the time).
Here, the situation becomes quite complicated. At the instruction level, there are some pretty well-known heuristics; for example, if JNZ goes back (points to an instruction before itself) – it is considered a likely loop, and loops are considered to go back more likely than not, so CPU hardware will consider the outcome that goes back as a more likely thing; similar heuristics exist for other cases too. From a C++ perspective, this can be affected by [[likely]]/[[unlikely]] attributes.3
modern CPUs use so-called “dynamic branch prediction”
But this is not the end of the story; to make things even more elaborated, modern CPUs use so-called “dynamic branch prediction”; it means that for frequently-used branch operations, CPU stores runtime statistics on “how often this branch was chosen in the past”, and makes branch predictions accordingly. Given this, efficiency of [[likely]]/[[unlikely]] attributes is not as high as it might have seemed. Sure, these attributes are still working when a totally new branch instruction (the one for which there is no statistics yet) is encountered, but this is by definition fairly rare.
In addition, developers are notoriously bad in guesstimating what is likely and what is not; overall, we would not recommend using [[likely]]/[[unlikely]] attributes, unless you are at least 200% sure that the branch is indeed very unlikely. Examples of “when it does make sense” include error handling (hey, errors are expected to be rare), and outright edge cases such as going into complicated handling of huge values of x within sin(x), or into big-int special case when parsing double within strtod().
On TLBs
One thing which didn’t make it to our diagram of CPU core, is TLB (Translation Lookaside Buffer), which is usually divided into ITLB for instructions and DTLB for data.
TLB comes into play whenever our CPU has an MMU, and is all about translating virtual address into a physical one. These translations occur on each and every memory access, so obviously they are extremely performance-critical. In a sense, TLB is a cache (these days – usually a 2-level one) which effectively sits on top of L14 so that translation information can be read right within core without even going to L1.
for a de-pessimized C++ program relying mostly on vectors, we expect effects related to DTLB misses to be observably smaller to that of the programs written in C-style and relying on node-based data structures
While in theory TLB misses can be quite expensive (in the extreme case, page-table load can go all the way to main memory, ouch) – in practice, we’ve never encountered TLB to be an issue for application level.5 BTW, pressure on DTLB is minimized by using linear data structures (such as vectors, see Hint [TODL: hint # re using vectors by default]) opposed to classical C-style node-based data structures such as linked lists or trees; as a result, for a de-pessimized C++ program relying mostly on vectors, we expect effects related to DTLB misses to be observably smaller to that of the programs written in C-style and relying on node-based data structures (and we didn’t see concerns related to long-running programs articulated in [Drepper, section 6.2.4] to materialize in RL – that is, for long-running vector-oriented C++ programs6).
OTOH, [Bakhvalov, section 8.4] speaks about DTLB misses being a problem in case of apps using enormous amounts of RAM (think databases and JVM); also it was noted in [JiaEtAl] that TLB costs grow disproportionally in virtualized environments. In any case, whenever TLB costs become significant, it usually can be handled fairly easily by switching to so-called huge CPU-supported pages (see e.g. [JiaEtAl] and [Bakhvalov, section 8.4]), phew.
As for ITLB misses, they’re discussed in [Bakhvalov, section 11.8] and also tend to apply only to seriously large apps (think Clang) and are also handled by huge pages.
Chip
Overall, these effects seem to compensate each other, and main memory access latencies of an x64 desktop box, and an M4 Apple SoC happen to be in the same ballpark of about 200-300 CPU cycles.
As we’re done with discussing core level diagram, we can go down Fig. 1 to chip-level diagram. Right besides each core we can see L3 cache (unlike L1 and L2 caches, L3 cache is traditionally shared among the cores). L3 cache usually takes around 30-70 CPU cycles to read. Going any further7 – and we actually end up going through all the DDR interfaces and out of the chip. And going out of the chip is inevitably Damn Expensive™ as at this point those parasitic capacitances which (as we mentioned above) effectively govern all the speeds, become poorly controllable and generally skyrocket ☹.
Note that while in theory SoCs with on-chip RAM have a potential to improve latencies of main RAM (simply because SoC is a better-controlled environment, especially with regards to parasitic capacities), in practice (a) the latencies are governed by standardized interfaces such as LPDDR5X, and (b) SoCs are typical for laptop/phone market, where power considerations limit the frequencies and therefore speeds. Overall, these effects seem to compensate each other, and main memory access latencies of an x64 desktop box, and an M4 Apple SoC happen to be in the same ballpark of about 200-300 CPU cycles.
Motherboard
ACID
Atomicity, Consistency, Isolation, Durability (though in this particular context, it is mostly about ensuring Durability)
Going further down Fig. 1, we reach motherboard-level diagram. Here, situation is pretty simple. As mentioned above, reading from main RAM usually takes within 200-300 CPU cycles (which is about 100x slower than L1 read – sic!). And any persistent storage is even slower: reading even from a blazing-fast NVMe SSD takes at least 30’000-45’000 CPU cycles (~10-15 µs8), for SATA SSDs we can expect 240’000 to 300’000 CPU cycles (80-100 µs), and for old-school HDD the typical numbers (that is, even if it doesn’t need to spin-up, but including typical seek times) are in the range of 30’000’000 – 45’000’000 CPU cycles9 (10-15 ms).
And speaking of latencies of fsync() (which are absolutely critical for databases) – the numbers go as follows (for fully-ACID writes): ~120’000 CPU cycles (40µs) for enterprise-level RAID controller with battery-backed cache,10 450’000 cycles (150 µs) for enterprise-level NVMe SSD, 1’500’000-30’000’000 cycles (0.5-10ms) for consumer-grade SATA SSDs, and 50’000’000-200’000’000 cycles (17-66ms) for HDDs [Trudeau].
Different Memory Storage from C/C++ POV
Now, as we went all the way from R-R to accessing main RAM (with L1-L2-L3 caches in between), let’s describe very very briefly how variables can be stored within memory from C/C++ point of view, and how does it affect performance:
·
as active portion of the stack is accessed extremely frequently, it is almost-guaranteed to be cached
- On stack (corresponds to “automatic storage duration” in C++ standard). This is our usual local function variables and function parameters (both – if not fitting to the CPU registers). Program stack has a special status from CPU point of view as it is supported by the hardware (at least SP pointer is there for ages); in addition to the variables mentioned, stack also stores return addresses of the functions.11 In spite of this special status, to the best of our knowledge, stack memory is cached using usual caching rules; still, as it is accessed extremely frequently, active portion of the stack is almost-guaranteed to be cached. Note that stack is specific to the current thread, and is limited in size; usually, by default it is limited to single-digit megabytes.12
- Static variables (“static storage duration”); this includes global and static variables, as well as function-level static variables and static data members. Their addresses, if we forget about DLLs, are pretty much known in compile-time. Technically, statics are usually mapped to 2 segments of the program executable, known as
.bssand.data(and there can also be.rodata). From our current perspective, the difference between them is not important; however, what is important to remember is that if a static variable is initialized without constructor – it gets its initial value even before the very first line of code of your program is executed (yes, that’s even before any constructor of a global object is executed). This allows to solve some of the nasty problems related to the order of the constructors of global objects. Cache-wise, static/global variables tend to be cached reasonably-well (unless they’re huge), but “reasonably-well” is no match for “almost-guaranteed” of the stack. - On heap data (“dynamic storage duration”); this includes whatever is allocated using malloc(), or new (or any dynamic allocations performed by STL containers using default
std::allocator). Heap can be arbitrarily huge, and it is its growth which usually causes excessive paging,13 making your system to slow down to a crawl. Cache-wise, heap data should be considered as uncached (sic!) – that is, unless we know that we recently accessed something nearby (that is, within 2 cache lines); in practice, we can more-or-less rely on caching of fields of already-accessed not-too-huge structs/classes, and on caching while we’re performing linear scans of the std::vector<>s and similar linear-in-memory data structures; note that linear scan is critical here, and, say, binary_search()/lower_bound() will not usually be able to benefit from caching when doing it over a sufficiently large vector 😔. - Thread-local variables (“thread storage duration”), indicated by
thread_localkeyword. Actually, each thread has its own TLS (Thread-Local Storage), which contains all such variables. There is no magic involved with TLS; it is just a thread-specific pointer (which compiler might put into a dedicated CPU register) which points to some allocated memory.14
IOHO
In Our Humble Opinion
Note that this is an extremely brief description of the memory in C++; for a detailed discussion, please refer to other sources; IOHO, [Ketron] and [Roy] provide a pretty good description of the topic, and from different angles too (though keep in mind that in a few places our advice contradicts [Ketron]).
Outside World
If going outside of our computer/phone (and to the right side of Fig. 1), things tend to slow down even more drastically. Typical access times over LAN are in the ballpark of 100’000-500’000 CPU cycles (~30-150 µs) for 1Gbit wired LAN, 3’000’000 to 30’000’000 cycles (1-10 ms) for local Wi-Fi, additional 15’000’000-80’000’000 (5-25 ms) to reach your ISP over fiber (for cable and DSL – expect 60’000’000 to 150’000’000 (20-50 ms), and for 4G LTE/5G – 100’000’000 to 200’000’000 (30-70 ms)15).
To go even further, from your ISP to the server ISP, will largely depend on the physical distance between cities involved (it is at this point when we can start using speed of light to estimate latencies); to go from Toronto to Montreal (~500km distance) and back takes like 24’000’000 cycles (8ms), to Dublin (~5200km distance) and back – 255’000’000 cycles (85ms) , and to Perth (~18000km distance, not too far from half-of-the-globe 20’000km) and back – 745’000’000 CPU cycles (250ms).
FMEA
Failure Modes and Effects Analysis
Therefore, for your phone in your Toronto home, connected via Wi-Fi to your local router , which is connected to your ISP using DSL, to reach Montreal server, it will take 3’000’000-30’000’000 cycles for Wi-Fi, plus 60’000’000-150’000’000 cycles for DSL, plus 24’000’000 cycles for your-ISP-to-server-ISP (plus some amount on the server side, but it will be within 3’000’000 cycles total, unless some heavy app processing is involved), so we can expect total to be within 100’000’000 to 200’000’000 CPU cycles (30-60ms). Let’s keep in mind though that whenever we’re speaking of the network, these times represent the best case, and the worst-case times can easily get into some kind of “infinity for practical intents and purposes” (and more often than not, “user gave up” does qualify as such an infinity; note though that proper FMEA of network failures is a huge subject per se and is well beyond the scope of this particular book).
- note that multiple full ALUs are at least not mandatory; it is common to have different numbers of different units: for example, 4 addition units, 4 OR units, and only 2 division units, but it doesn’t change overall philosophy. ↩
- usually, we can think that it takes 0-1 cycle or so (that is, unless we run into “write stalls”, but this is usually related to cache coherency/atomics, see e.g. [Josuttis]) ↩
- at some point in history, devs were using some compiler-dependent knowledge like “if branch is considered likely, and else branch - unlikely”; however, now, with
[[likely]]/[[unlikely]]attributes, any such trickery is no longer necessary. ↩ - [Cordes] asserts that “The page-table loads generated by the page-walk hardware can hit in L1, L2, or L3 caches” ↩
- It doesn’t mean TLB cannot be a problem – it just means we didn’t run into such scenarios in RL ↩
- FWIW, we didn’t observe it for a rather complex C++ vector-oriented program which routinely ran for several weeks at a time while processing around a billion of messages per day ↩
- not considering GPU, which is not in our current scope ↩
- assuming 3GHz CPU clock ↩
- don’t be surprised, for HDDs it involves moving parts and physical rotations, ouch ↩
- in this case, it doesn’t matter what is the storage behind – even HDD will do for fsync() with battery-backed RAID controller ↩
- as a very side note, it is this dualism of the stack which opens the door for attacks such as Return-Oriented Programming, but it is certainly not our subject now ↩
- actually, under most of the OS’s out there, initially only a part of the stack is actually mapped to physical RAM, and there is a “guard page” which, when accessed, causes a CPU exception which is intercepted by OS which in turn maps more physical RAM to the stack (see MAP_GROWSDOWN in mmap() for details). The size limit of the stack which we speak about, is the absolute limit after all the possibilities to map more RAM to the stack are exhausted. Note that such an expensive stack growth can easily cause ugly effects on first runs of micro-benchmarks. ↩
- also often not-exactly-correctly referred to as “swapping” ↩
- we can think of the memory where this TLS pointer points to, as heap – though it might or might not be a part of the regular heap; what is important is that these allocations are handled by the compiler so we don’t need to bother about them ↩
- that is, unless we're speaking about 5G URLLC, which is not exactly available yet ↩
References
[Fog] Agner Fog, Instruction tables. Lists of instruction latencies, throughputs and micro-operation breakdowns for Intel, AMD, and VIA CPUs ↩
[Fog04] Agner Fog, Optimizing software in C++ section 7.12 ↩
[Drepper] Ulrich Drepper, Memory part 5: What programmers can do section 6.2.4 ↩
[Bakhvalov] Denis Bakhvalov, Performance Analysis and Tuning on Modern CPUs section 8.4 ↩ section 8.4 ↩ section 11.8 ↩
[JiaEtAl] Weiwei Jia, Jiyuan Zhang, Jianchen Shan, Xiaoning Ding, Effective Huge Page Strategies for TLB Miss Reduction in Nested Virtualization 1 ↩ 2 ↩
[Trudeau] Yves Trudeau, Fsync Performance on Storage Devices ↩
[Ketron] Dominick Ketron, Modern C++ Memory Optimization 1 ↩ 2 ↩
[Roy] Patrice Roy, C++ Memory Management ↩
[Josuttis] Nicolai Josuttis, The Price of Shared Pointers or Why Passing them by-reference can be Useful ↩
[Cordes] Peter Cordes, answering 'What happens after a L2 TLB miss?' ↩


Comments